Hello, welcome to the Pokemon Stat Analysis page
HomeProject Introduction
This was a school project making use of data science and numerical computation techniques to analyze Pokemon data collected from online. Some of this code was developed with a partner, but all of the code and analysis shown here is my own. This is the first half of my work on this project, focusing on the data collection and cleaning aspects while the analysis portion is covered in the Numerical Computation page.
To begin with some background, Pokemon is a video game series that involves turn-based battling, Pokemon catching, and exploration. My focus is solely on the battling aspect, and moreso the competitive side. At this level of battling, Pokemon teams can be extensively customized, begging the question of:
Is the competitive Pokemon battling scene "healthy", in terms of variety and uniqueness being encouraged?
Data Collection
The first step in this process was to utilize the API for Pokemon Showdown. Showdown is a website that hosts a massive number of Pokemon battles between people, all of which are recorded and made freely available. Accessing this API is as simple as making a web request and parsing the JSON file that is returned.
Much of the data that were returned from these requests was not important to answering the question. This was because of an important limitation that I had put in place to ensure that the scope of the project remained manageable given the time constraints: Only team composition is relevant, and while a huge amount of variation in a battle can result from player actions taken during turns, that information will have to be implicitly summarized in their decisions made while composing their team. With this consideration in place, the scope of the necessary information become much more reasonable to analyze.

With the scope of the raw data fixed the necessary information was extracted and stored in a more convinient manner, although with many flaws still remaining.
Data Cleaning
Before beginning to process each of the condensed team representations some teams would be discarded. The check for an "unimportant" team at this stage was determined by whether they had fewer than six Pokemon. Six was the maximum number that could be brought, and having fewer represented that the player was either testing the team, or not taking the match seriously. Both conditions meant that their battle was not worth considering for this project.
The next cleaning step was to transform the data from only containing Pokemon names to instead containing the stats for each Pokemon. Each Pokemon is comprised of six stats, and although there are many more aspects of a team that can be customized they could not be numericized in a way that would make them suitable for this project.
My solution for the local lookup process was to create a local lookup table using stats returned from the PokeAPI service. The main benefit of compiling this extra local database was to eliminate API calls that would result when a Pokemon was used on multiple teams, which is a very common occurrence. Utilizing PokeAPI required an additional step: modifying the stored names of the Pokemon into forms recognizable to the API. The names that had been used were extracted from Pokemon Showdown, which used a different naming scheme than PokeAPI. This new transformation required a great amount of manual checks, with the unique features of many Pokemon preventing any simple translations.

With the corrections made, the lookup table was then applied to the dataset to reach its final, fully cleaned state.
Finalized Data Representation
Following the usage of the lookup table, the dataset was comprised of teams described by six numbers, with each number being the average of each stat from the team's Pokemon, as well as a boolean for whether the team won or lost the battle it was featured in. From this point forward, the remainder of the project was a much closer collaboration with my partner, who brought their expertise to incorporate the win/lose metric into our analysis. Briefly, we found that the battling scene was healthy from the appearance of numerous team archetypes showing success, compared to only one dominating. However, my work with these data would continue independently in the numerical computation part of the project.
Numerical Computation
My usage of the already-cleaned data continued in my project for my numerical computation class. While the data used here are the same, the end goal of what new information is being ascertained is different. With this new frame of mind, the question to ask was:
How do the stats of a Pokemon team influence its success?
Graph Construction
To be able to reach any conclusions about the data, I decided to graph every combination of two stats together. This resulted in 18 graphs showing combinations, with each plot featuring a blue line for winning teams and a red line for losing teams. These lines were constructed with cubic spline interpolation, a numerical technique that can create a spline connecting many points. The ability to create this sort of spline is offered by NumPy through a simple command call. The constructed lines were then combined into graphs and placed into one compilation to be further analyzed.
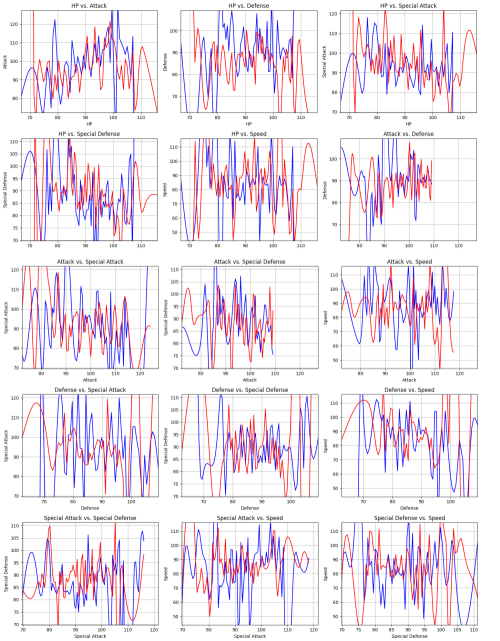
On first inspection, the graphs are clearly messy, and many do not contain notable information. However, there are still plenty of interesting points to analyze.
The graph of HP vs. Attack shows an upward trend with both winning and losing teams. This means that the two stats are correlated, but because this correlation exists regardless of the success of the team it is likely a pattern present in Pokemon designs rather than team designs.
The graph of HP vs. Defense shows more interesting results. Regardless of the defense of the team choosing a high or low HP value results in more success, as shown by the blue line deviating from the red line at the edges of the graph. Specifically, having low HP and low defense indicates an offense-focused team; having low HP and high defense creates a general balance of bulkiness, leaving room for other stats to influence a team's success; and having high HP and high defense makes a bulk-focused team. This begins a pattern present in many of the graphs that shows that having a specialization for a team results in more success than having an "all-rounder" team with no focus.
The graph of Attack vs. Special Attack shows a generally downward trend in winning and losing teams. The inverse correlation here shows that there are practically no Pokemon available to construct a team that has both offensive stats high. Most importantly from this graph is the separation between the two lines at high attack and low special attack. This is another example of choosing a specialization being beneficial compared to having no focus.
The graph of Attack vs. Speed shows no trend, although with two interesting exceptions. At low attack and high speed, successful teams are more prevalent; these might be support-based teams that have less of a need for physical damage output. At moderate attack and low speed, successful teams are similarly more present; these might be "Trick Room" teams that actually benefit from low speed stats. These disconnects from the unsuccessful teams shows that these specializations are again beneficial.
The graph of Special Attack vs. Speed shows a significant separation between the winning and losing teams. The important feature present throughout this graph is that low speed paired with any amount of special attack is successful, compared to the more general stat distributions seen in red. This is likely due to many slow, specially-focused Pokemon receiving more support options than similar Pokemon with physical focuses.
Conclusion
The most important part of the conclusion is that the initial question seems to be useless for analyzing the data. In reality, there is no single stat that makes a significant difference in the success of teams. Rather, a specialization or focus in any stat results in more success compared to a team with fully average stats.
Additionally, the data analysis of this project was slightly limited by the tools available in the classes that these projects were based around. I believe that there are more options available to me outside of the classes that would enable me to make clearer conclusions about the data. These options might range from simple scatter plots to training various models with different types of artificial intelligence to identify patterns automatically.